
The FQ Trend Histogram Signals Forex Indicator for MetaTrader 4 (MT4) is a versatile and reliable tool designed to help traders analyze market trends and make more informed trading decisions.
This indicator offers a unique way to visualize price movement, identifying key trend changes with easy-to-read signals.
Using a histogram format helps traders understand market momentum, allowing them to quickly spot potential buy or sell opportunities.
Whether you’re a beginner or an experienced trader, the FQ Trend Histogram Signals Forex Indicator is designed to improve your trading experience.
It provides clear, actionable signals that can be integrated into a variety of trading strategies.
Indicator Description:
The FQ Trend Histogram Signals Forex Indicator for MT4 is a trend-following tool that helps traders identify potential reversals or continuations in the market.
The indicator plots a histogram on the chart, which is color-coded to represent the direction of the trend.
When the histogram bars are green, it indicates a bullish trend, while red bars suggest a bearish trend.
This indicator also provides signals for both buy and sell trades, making it easier for traders to enter or exit positions.
By following these signals, traders can capture price movements in the direction of the prevailing trend, which can help optimize entry points and minimize risk.
In addition, the FQ Trend Histogram Signals Forex Indicator can be used in various market conditions, from trending markets to ranging or consolidating ones.
This adaptability makes it a valuable addition to any trader’s toolbox.
Download Now:
⬇️ Download “FQ Trend Histogram Signals” Forex indicator here
File name: “FQ_Trend_Histogram_Signals.ex4”
Simply click the download link above to add this valuable tool to your MT4 platform and start improving your trading strategy today.
Top MT4 Forex Broker for Trading with this Indicator:
💰 XM – Claim your $30 Trading Bonus here
Indicator Chart:
The chart below demonstrates how the FQ Trend Histogram Signals Forex Indicator appears in action on an MT4 chart.
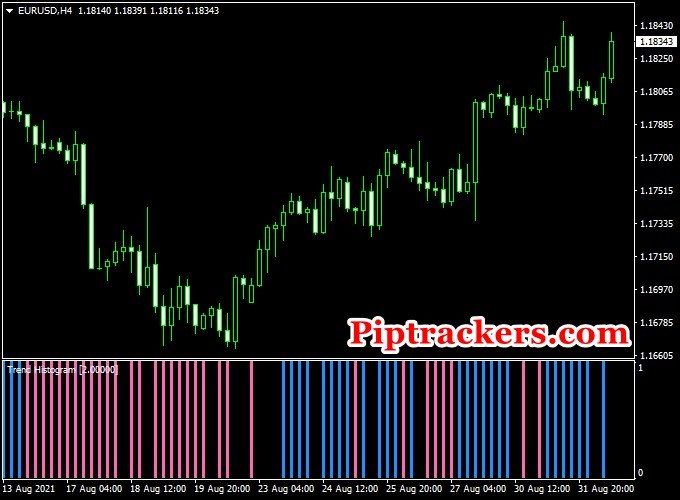
The longer the bars, the stronger the trend. The histogram will help you visually confirm whether a trend is gaining momentum or starting to lose steam.
This makes it easier to spot key entry and exit points for both buy and sell trades.
Buy and Sell Trade Logic:
The FQ Trend Histogram Signals Forex Indicator generates clear signals for both buy and sell trades. Here’s how to use it effectively:
Buy Signal:
- When the histogram turns blue, it indicates that the market is in an uptrend.
- Entry: Open a buy position when the histogram first turns green.
- Stop Loss: Place the stop loss below the most recent swing low to protect your position.
- Take Profit: Set the take profit level based on your preferred risk-to-reward ratio or the next significant resistance level.
Sell Signal:
- When the histogram turns red, it indicates that the market is in a downtrend.
- Entry: Open a sell position when the histogram first turns red.
- Stop Loss: Place the stop loss above the most recent swing high to limit potential losses.
- Take Profit: Set the take profit level based on your desired risk-to-reward ratio or the next support level.
Indicator Settings:
The FQ Trend Histogram Signals Forex Indicator comes with a variety of customizable settings, allowing you to tailor it to your specific trading style.
Some of the key settings include:
- Histogram Color: Adjust the colors of the histogram bars to match your preferences or to make them stand out more clearly against your chart background.
- Signal Period: This setting controls how sensitive the indicator is to price movements. Shorter periods make the indicator more reactive to recent price action, while longer periods smooth out the signals.
- Signal Alerts: Enable or disable alerts for buy and sell signals, ensuring you’re notified when the indicator generates a new trading opportunity.
These customizable settings help you fine-tune the indicator to suit your trading strategy and preferences.
Download The Indicator:
⬇️ Download the “FQ Trend Histogram Signals” MT4 Indicator now
File name: “FQ_Trend_Histogram_Signals.ex4”
Interesting Combinations:
To enhance the effectiveness of the FQ Trend Histogram Signals Forex Indicator, consider combining it with other popular MT4 indicators like the Moving Average (MA) or the Relative Strength Index (RSI).
For example:
Strategy with FQ Trend Histogram and RSI:
- Buy Signal: When the histogram turns green and the RSI is above 50, it confirms the strength of the bullish trend. Enter a buy trade when both conditions are met.
- Sell Signal: When the histogram turns red and the RSI is below 50, it indicates a strong bearish trend. Enter a sell trade when both conditions align.
Entry: Enter a buy trade when both the histogram and RSI confirm a bullish trend. Enter a sell trade when both the histogram and RSI confirm a bearish trend.
Stop Loss: Use the previous swing high/low as a stop loss.
Take Profit: Use a 2:1 risk-to-reward ratio or the next support/resistance level.
Frequently Asked Questions (FAQ):
Q: What is the FQ Trend Histogram Signals Forex Indicator used for?
A: It is used to identify trends and generate buy and sell signals based on the strength and direction of the market trend.
Q: How do I customize the FQ Trend Histogram Signals Forex Indicator?
A: You can adjust settings such as histogram color, signal period, and enable/disable alerts to match your trading style.
Q: Is this indicator suitable for all market conditions?
A: Yes, the FQ Trend Histogram Signals Forex Indicator can be used in trending, ranging, and consolidating market conditions.