The Waddah Attar ADX + Bollinger Bands Forex Indicator is a powerful tool for traders using the MetaTrader 4 (MT4) platform.
By combining the Average Directional Index (ADX) with Bollinger Bands, this indicator helps traders accurately identify trending markets and potential reversals.
With its simple yet effective strategy, it is ideal for traders looking to refine their entry and exit points based on market momentum.
Indicator Description:
The Waddah Attar ADX + Bollinger Bands Indicator displays trend signals using two key components: ADX and Bollinger Bands.
The ADX helps assess the strength of the trend, while the Bollinger Bands provide insight into market volatility and potential price breakouts.
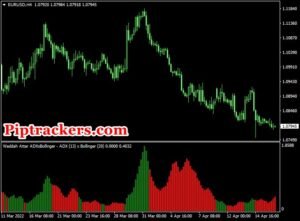
This indicator appears as a histogram, located in the bottom window of the MT4 platform.
Green bars represent a strong upward trend, while red bars indicate a downward trend.
Traders can use these signals to confirm potential buy or sell opportunities.
One of the significant benefits of this indicator is its user-friendly interface.
The signals are easy to interpret, making it suitable for both novice and experienced traders.
It works on any time frame and currency pair, offering flexibility to fit a variety of trading strategies.
Additionally, it is reliable, non-repainting, and does not slow down the MT4 platform.
Download Now:
⬇️ Download Waddah Attar ADX + Bollinger Bands Forex Indicator here
File name: “Waddah_Attar_ADXxBollinger.mq4”
Simply click the download link above to add this valuable tool to your MT4 platform.
It is compatible with any currency pair and can be used across different time frames, giving you the flexibility to integrate it into your trading strategy.
Top MT4 Forex Broker for Trading with this Indicator:
🌟 XM – Claim your $30 Trading Bonus here
Indicator Chart:
Take a look at the chart below to see the Waddah Attar ADX + Bollinger Bands indicator in action.

This chart displays how the indicator plots signals and trends, helping traders visualize potential market movements.
On the chart, the green and red bars of the histogram appear in the bottom window, providing a clear indication of market trends.
A green bar signals the start of a bullish trend, while a red bar signals the beginning of a bearish trend.
These bars help traders understand when to enter or exit a trade based on the strength of the trend.
Buy and Sell Trade Logic:
- Buy Signal: A buy signal is triggered when the first green Waddah trend bar appears. Traders should place their stop loss below the previous support level and use their preferred take profit method for exits.
- Sell Signal: A sell signal is generated when the first red Waddah trend bar appears. Stop losses should be placed above the previous resistance level, with take profit set according to the trader’s preferred strategy.
Indicator Settings:
The Waddah Attar ADX + Bollinger Bands Indicator offers customizable settings to suit different trading styles. Key settings include:
- ADX Period: Adjust the ADX period to fine-tune the strength of trend signals.
- Bollinger Bands Period: Set the period for the Bollinger Bands to control the volatility measurement.
- Sensitivity: Adjust the sensitivity to make the indicator more or less responsive to price changes.
Traders can experiment with these settings to create a setup that best fits their trading style and strategy.
Download The Indicator:
⬇️ Download the Waddah Attar ADX + Bollinger Bands MT4 Indicator now
File name: “Waddah_Attar_ADXxBollinger.mq4”
Click the download link above to install the Waddah Attar ADX + Bollinger Bands Forex Indicator on your MT4 platform and start trading with a clearer view of market trends.
Interesting Combinations:
The Waddah Attar ADX + Bollinger Bands Indicator works well when combined with other indicators like the Moving Average (MA) or the Relative Strength Index (RSI).
For example, combining this indicator with the MA can help confirm trend direction, while the RSI can be used to spot potential overbought or oversold conditions.
- Buy Signal: When the ADX + Bollinger Bands indicator shows a green bar, and the price is above the moving average, traders can look for an entry. Stop loss should be placed below the previous support level, with take profit at the next resistance.
- Sell Signal: When the indicator shows a red bar and the price is below the moving average, a sell signal is confirmed. Set the stop loss above the previous resistance level, with take profit set according to your risk management strategy.
Frequently Asked Questions (FAQ):
Q: Does the Waddah Attar ADX + Bollinger Bands indicator repaint?
A: No, this indicator is non-repainting, meaning the signals remain the same once they are plotted on the chart.
Q: Can I use this indicator on different time frames?
A: Yes, the Waddah Attar ADX + Bollinger Bands Indicator is compatible with any time frame, from minute charts to daily charts.